Physics Study Of Simple Harmonic Motion - Hooke’s Law
This was the given for the project:
Objective: To investigate SHM motion by, determining the relationship between Force and Distance (x) for a spring, and the Force Constant (k) of a Spring.
Showing experimentally that the period ( T) of the motion of a mass (m) hanging from a spring depends on m and k in a manner given by the equations for SHM.
Materials:
- Spring Mass Hanger Masses (1 unknown mass).
- Timer.
- Metal rod for mounting spring.
Procedure:
1. Write an equation relating Force (F), distance ( x), and the force constant of a spring (k). State Hooke's Law in a sentence.
2. Plot a graph of Force F (in Newtons) vs. distance x ( in meters) for both springs on the same graph. Remember you only measured mass in grams. Do not forget to change units and multiply by g. Remember to use proper graphing techniques and clearly label your graph.
3. Find the slope of each the lines. What are the units and what do the slopes represent? Recall Hooke’s Law.
4. Using your graph, determine the weight of your unknown object from its x. The weight is equal to the Force F. Calculate its mass (F/g). Determine % error between the actual mass(printed on the object) and calculated mass. Use actual mass as the theoretical value.
5. Compare the force constants (k) for the two springs by comparing slopes of their curves. Clearly state a conclusion about the force constant k and the "stretch" of a spring.
6. Answer the following questions for both springs: Plot the period squared (T2) versus the mass (m) that was hung on the spring. Remember to use proper graphing techniques and clearly label your graph.
7. Answer the following questions for both springs: Since T2 = (4* PI2*/k) *m for a simple harmonic oscillator, what sort of graph should be obtained when plotting T2 versus m for such a system? What would be the slope of such a plot? Do your plots from question 6 above yield similar results? Let the values of k you found in step 3 above be called ktheoretical1 & ktheoretical2. Now find the slopes from your plots in question 6 above. Compute the values of k from each of these slopes. Call these values kexperimental1 and kexperimental2 . Compare each pair of slopes by doing a percent error calculation. Do the values agree within reason? Why or why not?
8. BONUS: 5 points. So far it has been assumed that the mass of the spring is negligible. If such were the case, would your graph pass through the origin. If such is not the case, at what added mass, m, does T= 0 correspond to on your graph? To interpret this result, consider the mass m in the equation T2 = (4* PI2*m)/k to be the total mass in motion including some contribution from the spring. Them m = ma + me, where ma is the mass added to the spring and me, is that part of the spring mass which is effectively part of the load. Assume me is constant and rewrite the equation for T2 in terms of ma and me. From a graph of T2 versus ma determine me. Compare your measured me with the total mass of the spring. Explain why it is less than the total mass.
9. Identify 2 sources of systematic error.
10. Identify 2 sources of random error.
Conclusion: As always state what you learned not what you did.
The findings are in the PowerPoint file “shm_presentation.zip”.
Team Member: Abdurrahman Naser.
Objective: To investigate SHM motion by, determining the relationship between Force and Distance (x) for a spring, and the Force Constant (k) of a Spring.
Showing experimentally that the period ( T) of the motion of a mass (m) hanging from a spring depends on m and k in a manner given by the equations for SHM.
Materials:
- Spring Mass Hanger Masses (1 unknown mass).
- Timer.
- Metal rod for mounting spring.
Procedure:
- Attach a spring to the metal rod. Record the start position of the spring (x0).
- Attach the mass hanger to the bottom of the spring and load it with a mass; record the mass and the distance stretched x. You must use enough mass to achieve smooth oscillation, but you must NOT exceed the elastic limit of the spring!
- The amplitude (How much you stretch the spring) of oscillation only needs to be about 5 cm.
- Record the attached mass (remember the mass hanger) and the time for one complete oscillation (up and down). It is very difficult to time one oscillation -- how can we improve precision?
- Use at least five different masses spread over the allowable range for smooth oscillation. If you choose masses too close together, your best fit line will be imprecise.
- Place an unknown mass on the spring and record the position (x), then find its actual mass.
- Change springs and repeat the experiment.
1. Write an equation relating Force (F), distance ( x), and the force constant of a spring (k). State Hooke's Law in a sentence.
2. Plot a graph of Force F (in Newtons) vs. distance x ( in meters) for both springs on the same graph. Remember you only measured mass in grams. Do not forget to change units and multiply by g. Remember to use proper graphing techniques and clearly label your graph.
3. Find the slope of each the lines. What are the units and what do the slopes represent? Recall Hooke’s Law.
4. Using your graph, determine the weight of your unknown object from its x. The weight is equal to the Force F. Calculate its mass (F/g). Determine % error between the actual mass(printed on the object) and calculated mass. Use actual mass as the theoretical value.
5. Compare the force constants (k) for the two springs by comparing slopes of their curves. Clearly state a conclusion about the force constant k and the "stretch" of a spring.
6. Answer the following questions for both springs: Plot the period squared (T2) versus the mass (m) that was hung on the spring. Remember to use proper graphing techniques and clearly label your graph.
7. Answer the following questions for both springs: Since T2 = (4* PI2*/k) *m for a simple harmonic oscillator, what sort of graph should be obtained when plotting T2 versus m for such a system? What would be the slope of such a plot? Do your plots from question 6 above yield similar results? Let the values of k you found in step 3 above be called ktheoretical1 & ktheoretical2. Now find the slopes from your plots in question 6 above. Compute the values of k from each of these slopes. Call these values kexperimental1 and kexperimental2 . Compare each pair of slopes by doing a percent error calculation. Do the values agree within reason? Why or why not?
8. BONUS: 5 points. So far it has been assumed that the mass of the spring is negligible. If such were the case, would your graph pass through the origin. If such is not the case, at what added mass, m, does T= 0 correspond to on your graph? To interpret this result, consider the mass m in the equation T2 = (4* PI2*m)/k to be the total mass in motion including some contribution from the spring. Them m = ma + me, where ma is the mass added to the spring and me, is that part of the spring mass which is effectively part of the load. Assume me is constant and rewrite the equation for T2 in terms of ma and me. From a graph of T2 versus ma determine me. Compare your measured me with the total mass of the spring. Explain why it is less than the total mass.
9. Identify 2 sources of systematic error.
10. Identify 2 sources of random error.
Conclusion: As always state what you learned not what you did.
The findings are in the PowerPoint file “shm_presentation.zip”.
Team Member: Abdurrahman Naser.
| shm_presentation.zip |
| shm_background_information.doc |
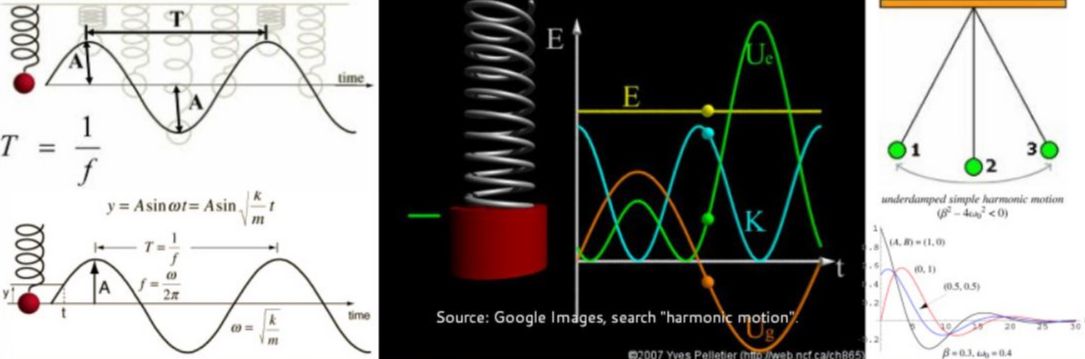
Physics Study Of Damped Harmonic Motion
This was the given for the project in the second physics preceding the first class that the project "Simple Harmonic Motion" was assigned.
" Determination of the damping constant for a damped simple harmonic oscillator
Goal: Your group is to accurately determine the damping coefficient for a Simple Harmonic Oscillator being damped due to
air or water resistance.
Procedure and Apparatus: No procedure is given for this lab. YOU are to determine what procedure to follow.
It is up to you, the experimenter, to design the experiment. That is, you must determine: what to measure, how set up your
apparatus, how you are going to calculate the damping coefficient, what measurement tools to use, and the uncertainty
associated with your tools.
Your Lab Report: You will complete a standard lab report. Make sure to include a sufficient explanation of the relevant
theory and complete solutions to the DSHO equation. Make sure to include a diagram of your experiment in the report. Make
sure to cite any references you use.
Real World Applications: Give 3 examples of real-world applications of DSHO: Provide information on how DSHO is
relevant and applicable to the examples that you choose. "
This was one of the most involved projects that I worked on. It required a lot of calculus that was not covered in my other classes at that point in time. A lot of research was done to understand this phenomenon. Below is a zip file that contains the PowerPoint presentation and some video files that are needed for the presentation.
| damped_shm_presentation.zip |
For a more in depth look at the work, you can find that in the lab report.
| final_lab_report_damped_simple_harmonic_motion.docx |
Team Members: Thai Pham; Jason Preston; Julian Moore; Matthew Buras.
